No edit summary Tag: 2017 source edit |
No edit summary Tag: 2017 source edit |
||
| Line 49: | Line 49: | ||
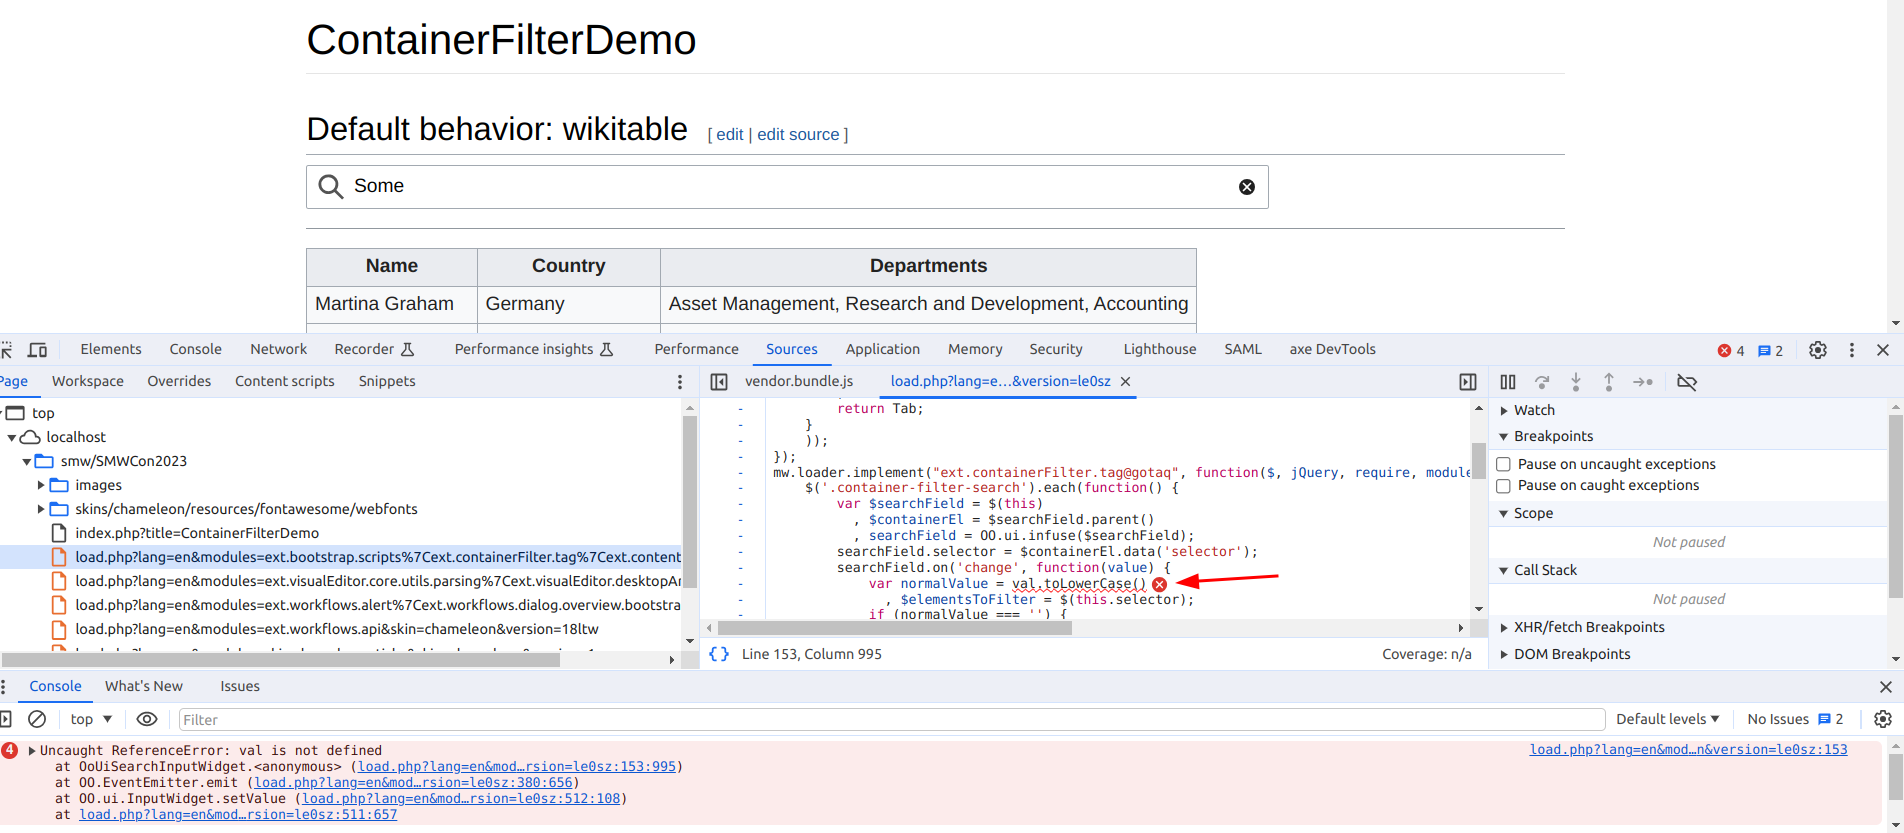
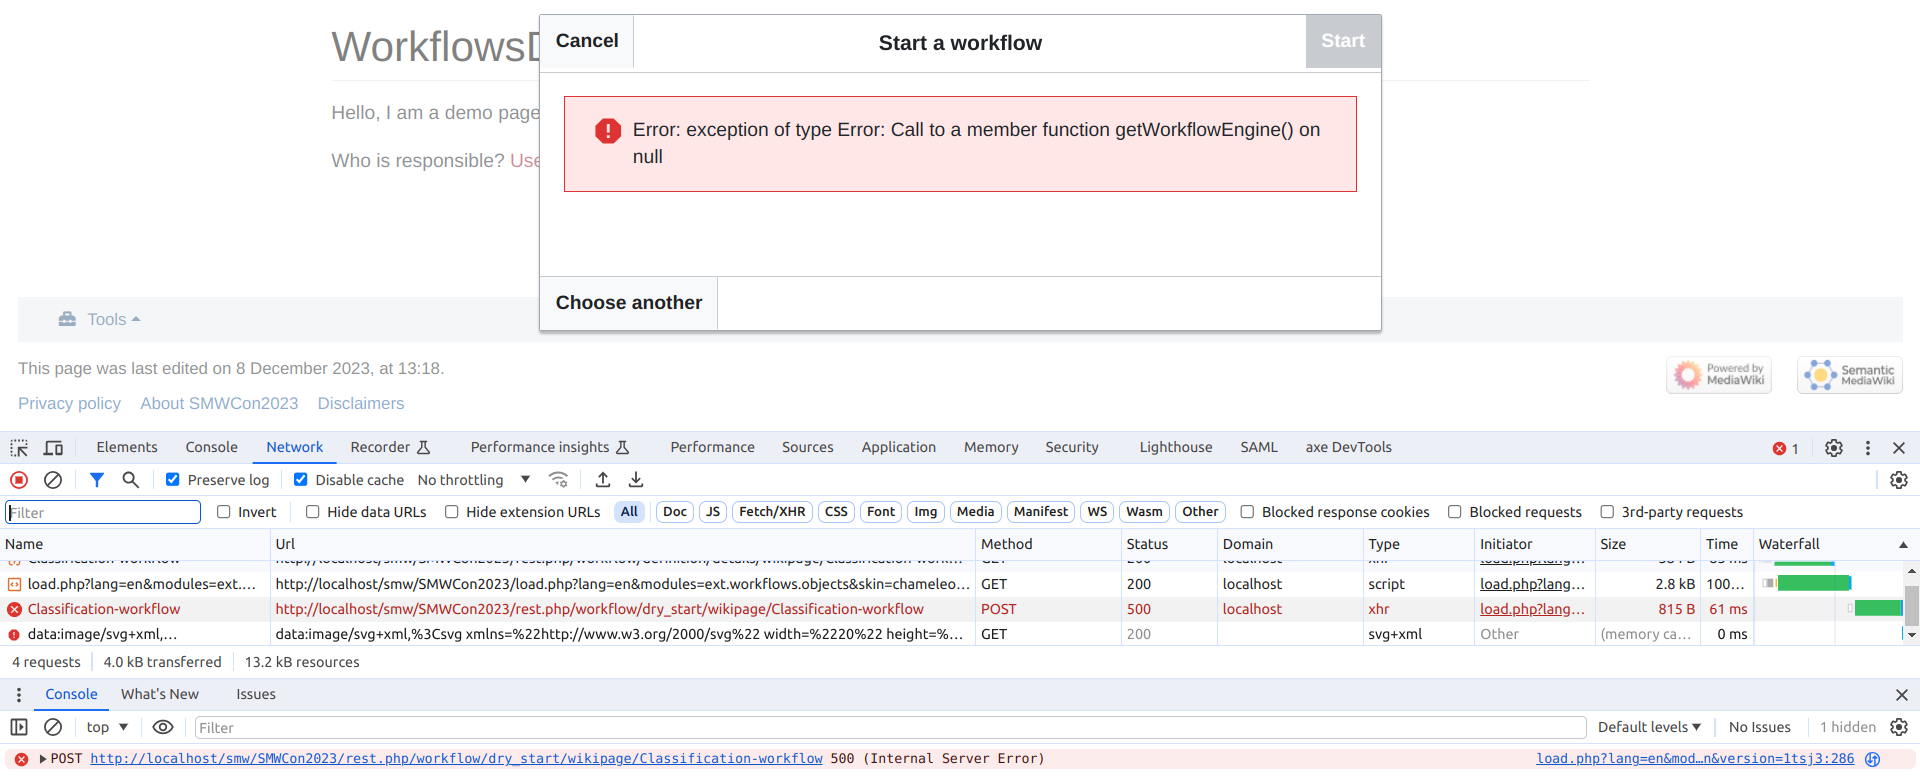
When some interface element (button, dialog, ...) does not behave like it should, it is usually worth checking the browsers JavaScript console. | When some interface element (button, dialog, ...) does not behave like it should, it is usually worth checking the browsers JavaScript console. | ||
{{Textbox|boxtype= | {{Textbox|boxtype=tip|header=Nothing listed?|text=Sometimes it may be required to re-do the action that lead to the error with ''open console'' rather than opening it later.}} | ||
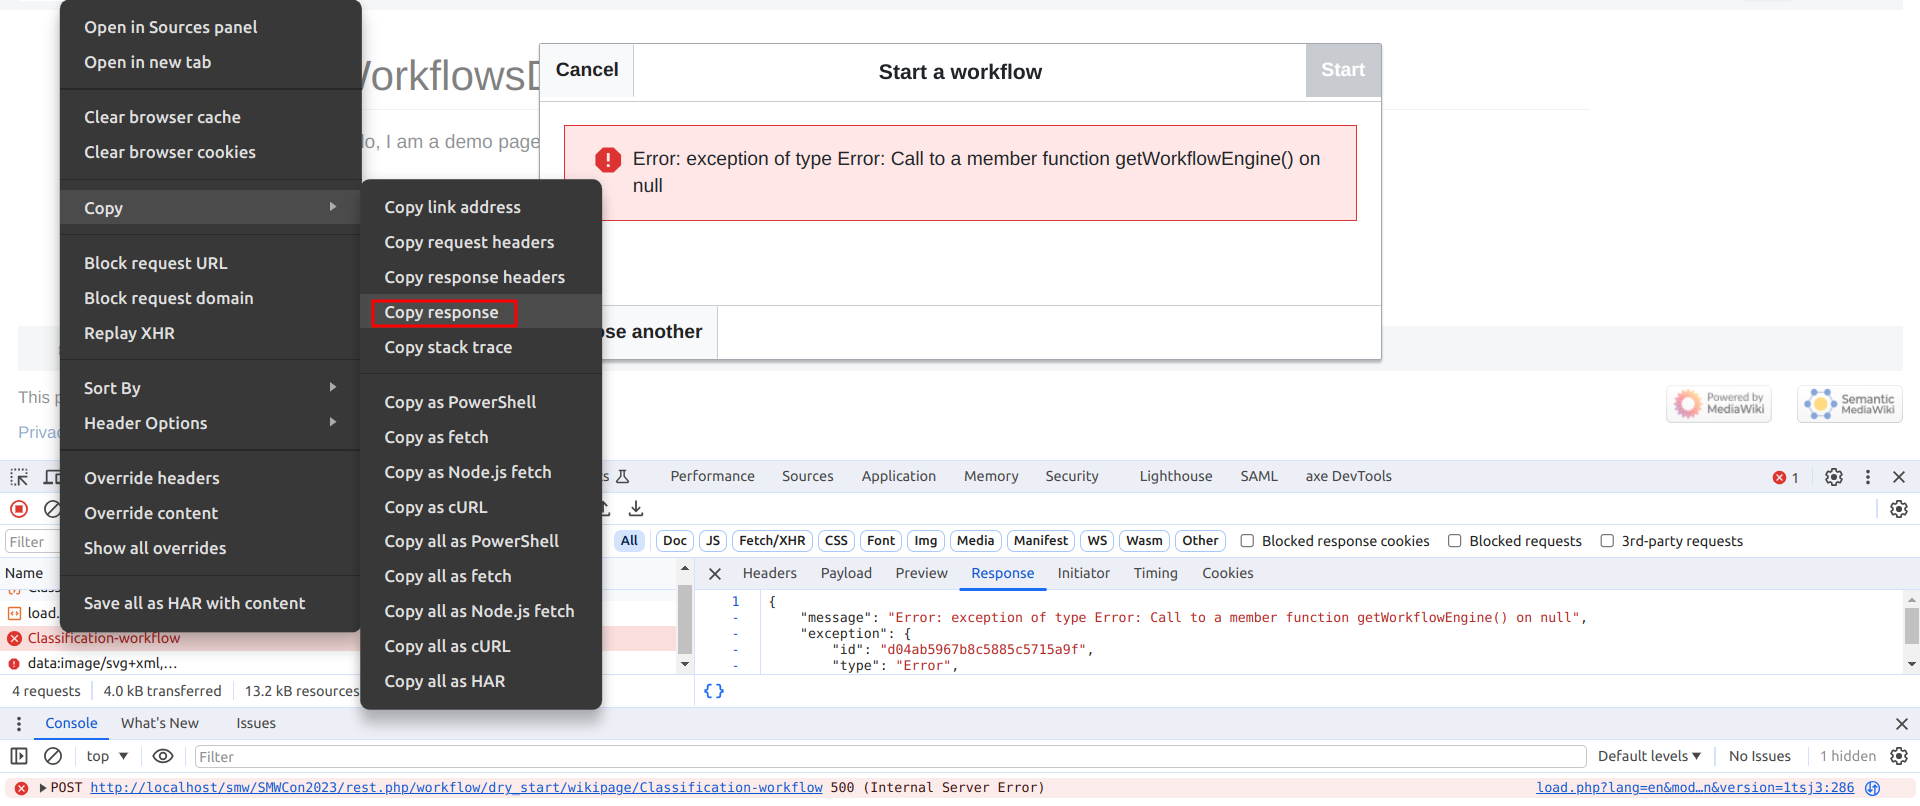
'''Example:''' | '''Example:''' | ||
Revision as of 10:09, 13 December 2023
Help others to help you
Sometimes things go wrong. In many cases the user is then confronted with cryptic or no error messages at all. This page provides help about getting more information about what exactly went wrong, so it can be fixed quickly. This is especially important when asking for help on locations like community.bluespice.com.
Additional information can also be found at "Manual:How to debug" on MediaWiki.org.
Generic information
In general it is a good idea to provide additional context information about the error. Usually this information is easily to access/gather by the one who reports an error and very valueable to anyone trying to help.
Such information can be
- Browser used (Firefox, Chrome, Edge, ...), ideally with the version
- URLs (which page the error occurs on, additional parameters that may play into the error)
- User permission level or role (admin, reader, editor, reviewer, ...)
Again: Be careful if the shared information contains sensible data and redact it if required.
Server side debugging
There are various ways to get more information about errors by changing some configuration on the server side.
Wiki application
Enable detailed error reporting
Within you LocalSettings.php file, please add the following lines:
$GLOBALS['wgShowSQLErrors'] = true;
$GLOBALS['wgDebugDumpSql']  = true;
$GLOBALS['wgShowExceptionDetails'] = true;
$GLOBALS['wgShowDBErrorBacktrace'] = true;
This will turn error messages like internal_api_error_DBQueryError into a more detailed stack of program calls, including database queries and responses.
General debug log
Sometimes it can be useful to see all debugging information the application produces. To enable this general debug log please add the following lines within you LocalSettings.php file:
if ( isset( $_GET['dodebuglog'] ) ) {
    $GLOBALS['wgDebugLogFile'] = "$IP/cache/debug.log";
}
Be aware that this configuration is set conditionally. It will only be used if the URL accessed in the browser contains some query string like dodebuglog=1. This is to allow a more isolated debug log file. Otherwise other requests (like calls to the load.php entrypoint for CSS and JS content) may also add into this file, which makes analysis more difficult.
Log channels
Client side debugging
Many errors occur only on the client and server side debugging will not help. In such cases the webbrowser can be used to retrieve more information.
Browser development tools
Most modern browsers have sophisticated development tools. Usually they can be accessed by pressing the F12 key on the keyboard.
JavaScript console
When some interface element (button, dialog, ...) does not behave like it should, it is usually worth checking the browsers JavaScript console.


